- Learn how to get around in the NetDiver window and work with the data (see The NetDiver Window at a Glance).
- Create a view of the data that you want (see Diving into the Data).
- Save your dive as a marker. (Creating a Marker for a Report).
- Specify a report style, title, date, and other formatting information to create a report that you can save as a PDF (Formatting an Ad Hoc Query as a Report).
- Change from one plot type to another, select a different data column or dimension, or add effects, like 3D (See Changing the Plot Type).
- Review the dives in your session (see Reviewing the Dive History). For more information on NetDiver, see the separate NetDiver User Guide.
The NetDiver Window at a Glance
When you need more flexible and focused queries than the standard Analytics Dashboard reports, use the Dimensional Insight NetDiver application. The NetDiver application is launched from the Report Library tab of the Analytics Dashboard. NetDiver opens in a separate browser window. You can move back and forth between the Commure Pro Analytics and NetDiver windows. The NetDiver window has two data display areas (Dive Window and Console) and a toolbar. Each area can be opened or closed separately. So when you’re working on a dive, you can have the Dive Window and Console open; then when you want more display area to see the results, you can close the Console.
Dive Window
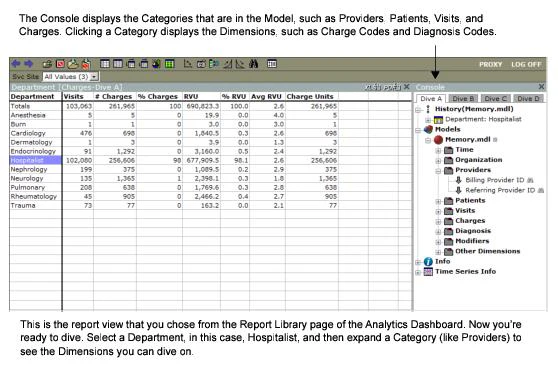
The Dive Window is where the data is displayed. With each dive, the Dive Window is updated with the results. For example, choosing the Charge & RVU Volume with All Charges report displays charge information for each Department. You can then dive into a department to see what’s behind the numbers. Compare this to the Analytics Dashboard, where the report stops at the Department level. For example, with NetDiver you could dive into the Cardiology department at your facility to see which diagnoses are used most frequently, and find out that “Benign Essential Hypertension” leads the list.Console
The Console window is where you work on your dives and track where you’ve been. You can create up to four dives a session. Each dive is on a separate tab (Dive A through Dive D). The Dive Session has three sections: History, Models, and Info. These sections can be collapsed and expanded using the plus and minus signs. History keeps track of where you are in the Dive. Every time you move to another dimension, it is added to the History list.
Models shows the current models and the dimensions, such as Time, Providers, Patients, Visits, and Charges.
Info lists every step you took in the dimensions to get to the final dive. Unlike the dive History, this is a static list. It’s a quick way to see what you looked at during the dive process.
History keeps track of where you are in the Dive. Every time you move to another dimension, it is added to the History list.
Models shows the current models and the dimensions, such as Time, Providers, Patients, Visits, and Charges.
Info lists every step you took in the dimensions to get to the final dive. Unlike the dive History, this is a static list. It’s a quick way to see what you looked at during the dive process.
Toolbar
The Toolbar icons are used to open and save data, and manipulate the display. The icons are conveniently grouped by function. They include icons to undo or redo; open files, open DiveBook, save markers, save into DiveBook; change tabular and report formats; flip axes, focus, group, sort, and find data; and show or hide the Console. Hovering over the icon shows its description.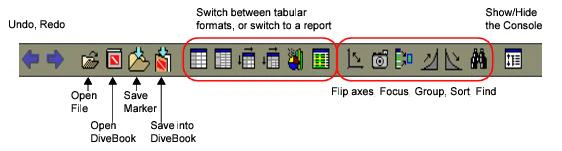
Creating Ad Hoc Reports Using NetDiver
The Report Library tab includes predefined Ad Hoc reports for Charge & RVU Volume, Charge Lag, CPT Codes, Visits, Referrings, and RVU. If you want to go beyond the packaged reports and create your own ad hoc report, you can launch NetDiver from here and “dive” into your Charge Capture data. Here are the basics of creating a new report:- Launch NetDiver from the Reports Library page of the Analytics Dashboard (see Launching NetDiver)
- Dive into the data (see Diving into the Data
- Create a marker to save the view (see Creating a Marker for a Report)
- Add formatting, like a title and date, to a report (see Formatting an Ad Hoc Query as a Report)
- Decide which plot type works best for the data. (see Changing the Plot Type) An ad hoc report starts with a dive into the data. You make your way through the dimensions of the data, such as Charges, Time, Providers, or Diagnosis until you narrow the search to exactly the information you want. Then you can save the dive as a marker so that you can retrieve it later. The marker data can be formatted and printed as a report.
Launching NetDiver
To launch NetDiver, follow these steps:- Log in to Commure Pro and click the Analytics tab.
- Click the Report Library tab.
-
Select NetDiver from the Application drop-down list on the right.
If you choose Direct, PDF, or Excel from the list, you are still working with the report from inside Charge Analytics. To launch the NetDiver application, you must select NetDiver.
- Select a report from the list on the left, and then select a reporting option from the list on the right.
Diving into the Data
A dive into the data lets you search for exactly what you want. You select an item in the Dive window and then apply a qualifier from the list of Dimensions in the Console. You can dive deeper, refining your query, until you are at the level of information you want. Let’s look at an example of a dive using the Charge Lag by Year report as a starting point. When you dive using NetDiver, you can look for answers to these kind of questions:- Which department has the longest lag times this year? If you look at the lag time by month, do you see consistent numbers? Or were long lag times limited to one bad month because of a known issue, such as administrator turnover?
- How does performance in the department this year compare with performance in previous years? Are lag times improving? Staying the same? Getting longer?
- How does this department compare to others? You can use the same dive to look at another department’s numbers. The Total Lag numbers will be different, but are the Admin Lag and Provider Lag numbers tracking about the same? To start a dive, follow these steps:
- Launch the NetDiver application.
- In the Dive Window, click the item in the left column that you want to dive on.
- In the Console window, click the plus sign (+) beside Models to display the categories.
- Click to expand the category and see the list of dimensions.
- Click the dimension you want to add to the dive.
- To continue a dive, select a data item on the left, click a category in the Console to select it, and then click the gray down arrow to dive to the next level. You can continue to dive if a down arrow is displayed in the category. So if you are diving on Cardiology, you could look at the number of charges and RVU by Gender.
Creating a Marker for a Report
When you have a dive that you want to use again, you can save it as a Marker (.mrk file type) in your directory. Then, you can use it as a new starting point for a dive, or run a report by selecting the Marker. The current Charge Capture data is used to calculate the results whenever you open the Marker. To create a Marker, follow these steps:- Launch the NetDiver application.
- From the Console, dive into the dimensions until you get the view you want.
- Click the Save Marker icon
 to open the Save Marker window.
- Select your folder name from the Look in drop-down list, then enter a name for the Marker in the File name field.
- Click Save to save the marker, or Cancel to close without saving.
Formatting an Ad Hoc Query as a Report
You can format an ad hoc query or a marker as a report. After formatting, you can save the report as a PDF. To format a view or marker as a report, follow these steps:- Launch NetDiver and complete a dive.
- Click the Switch the view to a Report icon in the Toolbar.
- In the Default Report dialog box, fill in the appropriate fields:
- Report Style: options include Tabular and Tabular With Others.
- Summary Stacking: you can stack up to sixteen summaries in a column.
- Title: enter a report title. The title is centered above the report.
- Totals: specify whether the totals appear at the top or bottom of the column.
- Subtotals: specify whether you want subtotals, and where they should appear (top or bottom of the column).
- Page Numbers: centers the page number at the bottom of the page.
- Date: adds today’s date to the report.
- Gridlines: Gridlines can make a large table easier to read.
- Fit to Page: limits the size of the report to one page.
- Include Print Header:
- Include Print Footer.
- Include Parent Info.
- Print the formatted report directly from this window. You can also:
- Click the PDF button to view the report as a PDF, and then print it.
- Click the XLS button to open the report in Excel, and then print it.
Changing the Plot Type
When you work with a marker or report in NetDiver, it starts as a tabular format. You can change the plot from tabular to bar, line, stacked, scatter, pie, or variations, such as 3D. You can also change back to tabular. Decide whether a graphic or tabular plot type works best to present the data. The graphic report types include:- Bar charts and line plots: show trends and comparisons for a small amount of data.
- Scatter plots: show the relative values for a large number of data sets.
- Stacked plots: show the relative portions that make up the whole of a value.
- Pie charts: best for comparing a small number of individual parts to the whole. The most frequently-used NetDiver tabular display formats include:
- Simple Tabular: similar to a spreadsheet.
- MultiTab: allows you to add up to 32 Dimensions to the table.
- CrossTab: allows you to combine two Dimensions in one table (one vertical Dimension and one horizontal Dimension). To change the plot type, follow these steps:
- Launch NetDiver from the Analytics Dashboard.
- From the NetDiver application, select the dive or marker that you want to plot.
- From the Toolbar, select a different plot type.
- Fill in the dialog box.
- Click OK to save your work, or click Cancel to close the dialog box without changing the plot.
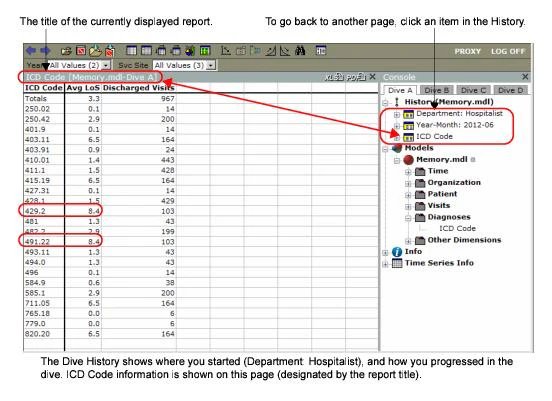
Reviewing the Dive History
As you step through the data and refine your search, your path is shown in the History section of the Console, located in the right-hand pane. The current page is indicated in the report title. Your dive sequence is listed from top (first dive) to bottom (last dive) in the History section of the Console. You can click any item in the dive history to go back to that page. For example, starting at the Reports tab, you choose the Visits, LoS by Year report. You decide to review the Hospitalist department, since it has the most discharged visits. In the first dive, you select the Hospitalist department and you dive down by Year-Month. You can now see that the 2012-06 month has the longest average length of stay. You select that month and then dive down by ICD Code to see which ICD code has the longest average length of stay in that month. We can see that 491.22 and 429.2 are tied for the longest average length of stay at 8.4 days each. ICD Code is the current page, as indicated in the report title. You can see the sequence of your dives from top (first dive) to bottom (last dive) in the History section of the Console.